A quiet exploration of repetition and spacing
From a floating tofu grid to a floating protein library: balance, negative space, and what happens when the subject is data.
- When
- Apr 2026
- Type
- Lab
- Tools
- Link
- www.jidienne.com ↗
Tofu, repeated and left to float.
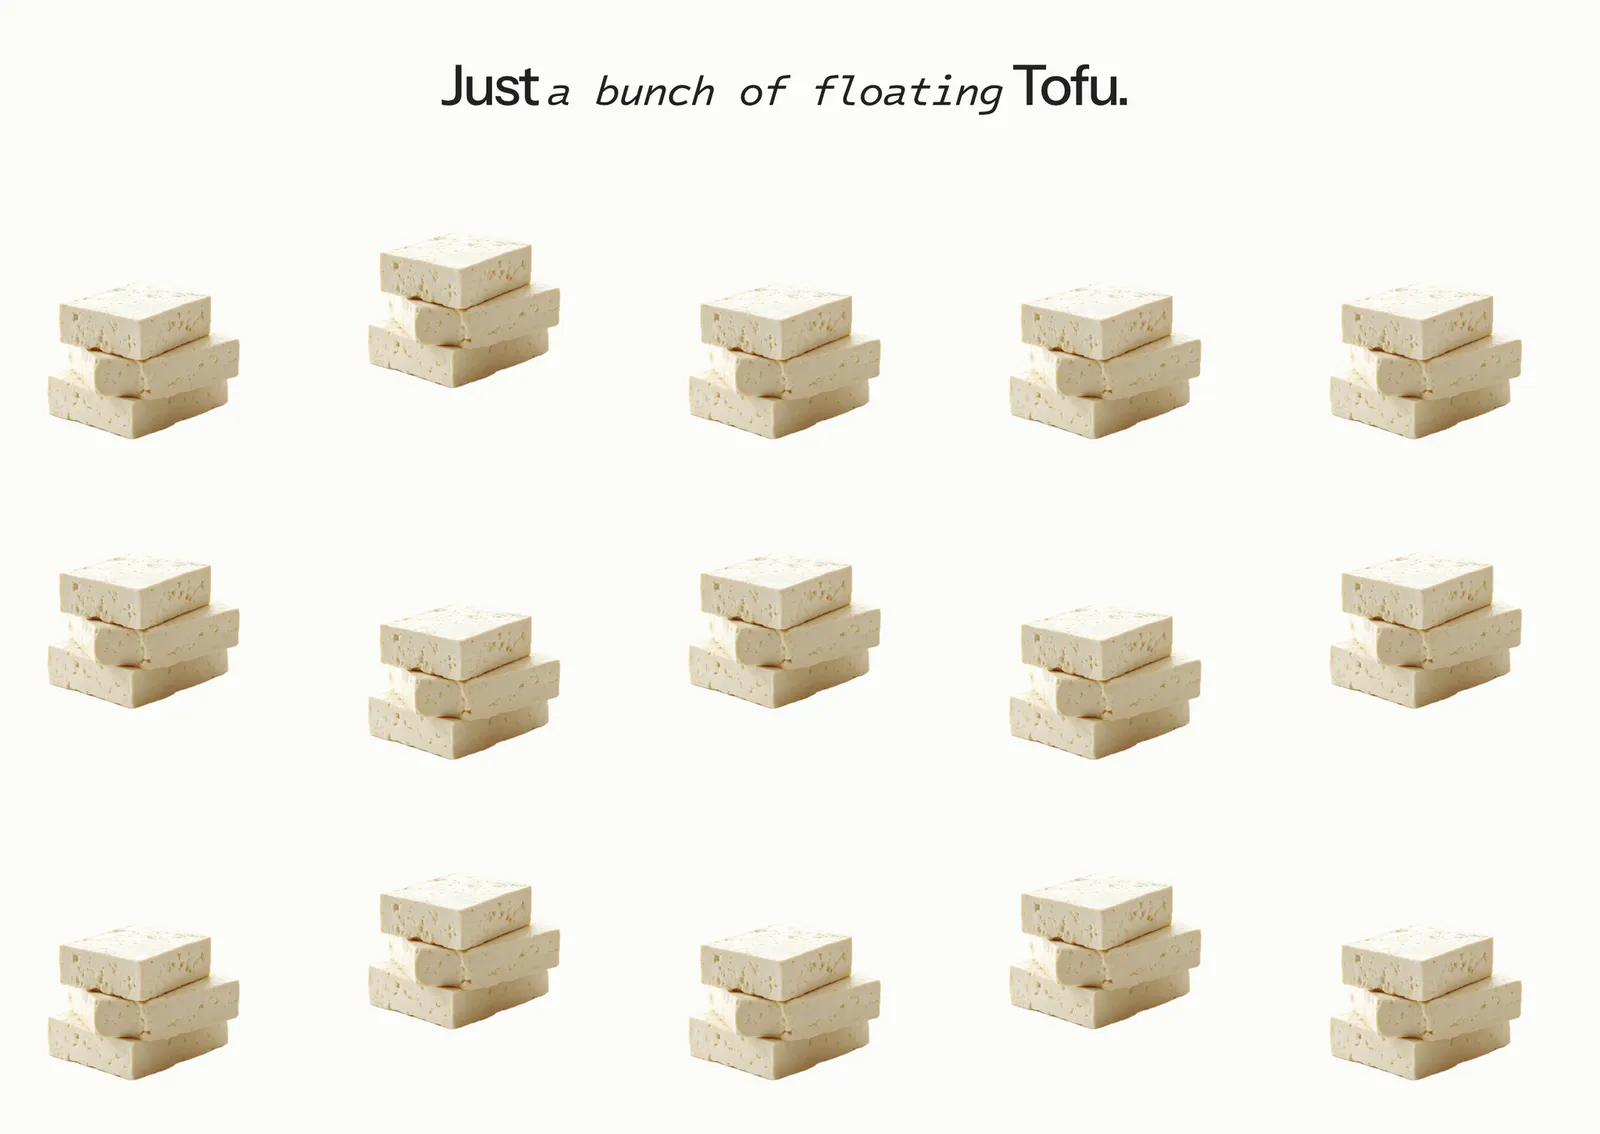
This started as a quick first draft for a prototype I had in mind…something functional, structured, and very much utility-first.
Somewhere along the way, I got distracted. The single ingredient became the focus, then the repetition, then the spacing. What was meant to be a simple building block turned into a small exploration of rhythm and visual calm.
This is the result of letting that tangent play out—a study in how far a single subject can go when you lean into composition, softness, and restraint.
Chapter two: what if the subject is data?
The tofu study left me with a question: what happens when the grid has to mean something? Same rule, repetition and spacing, but every item now carries real numbers.
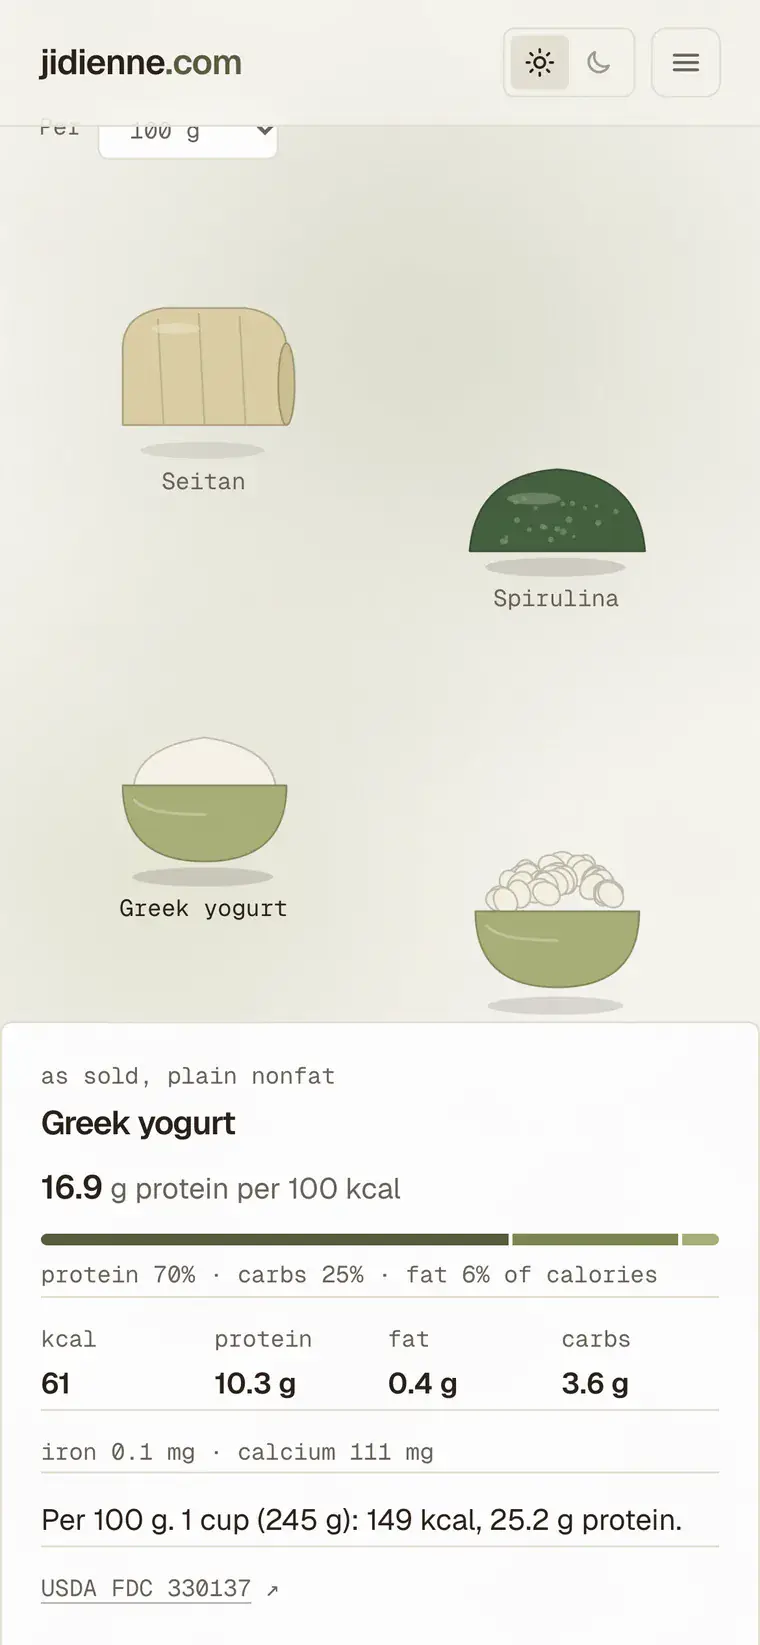
So I built it. Not meat is a library of 28 non-meat foods. Each one floats. Hover or tap and it opens its nutrition facts. It lives in a small playground section of the site, next to this study.
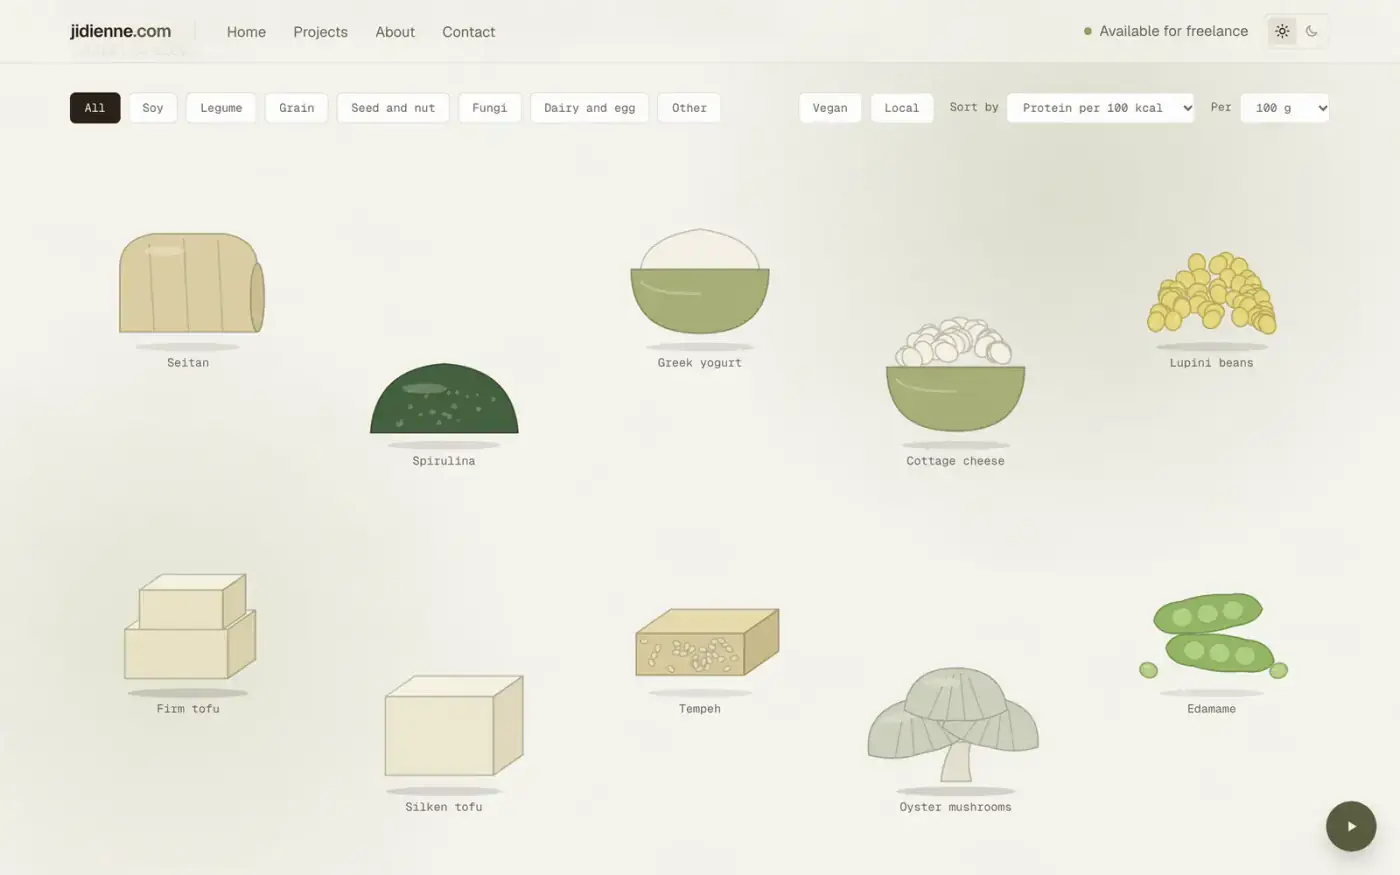
The decision: per calorie, not per gram
Sorting by grams of protein is the obvious choice and a slightly misleading one. Hemp seeds have 31.6 g of protein per 100 g, but also 553 kcal, so they land at 5.7 g per 100 kcal. Firm tofu has 17.3 g and 144 kcal, which is 12.0. Choosing the metric was the product decision, and the rest of the page follows from it.
Every item stays the same size. Size is never data. The sort order is how the data shows.
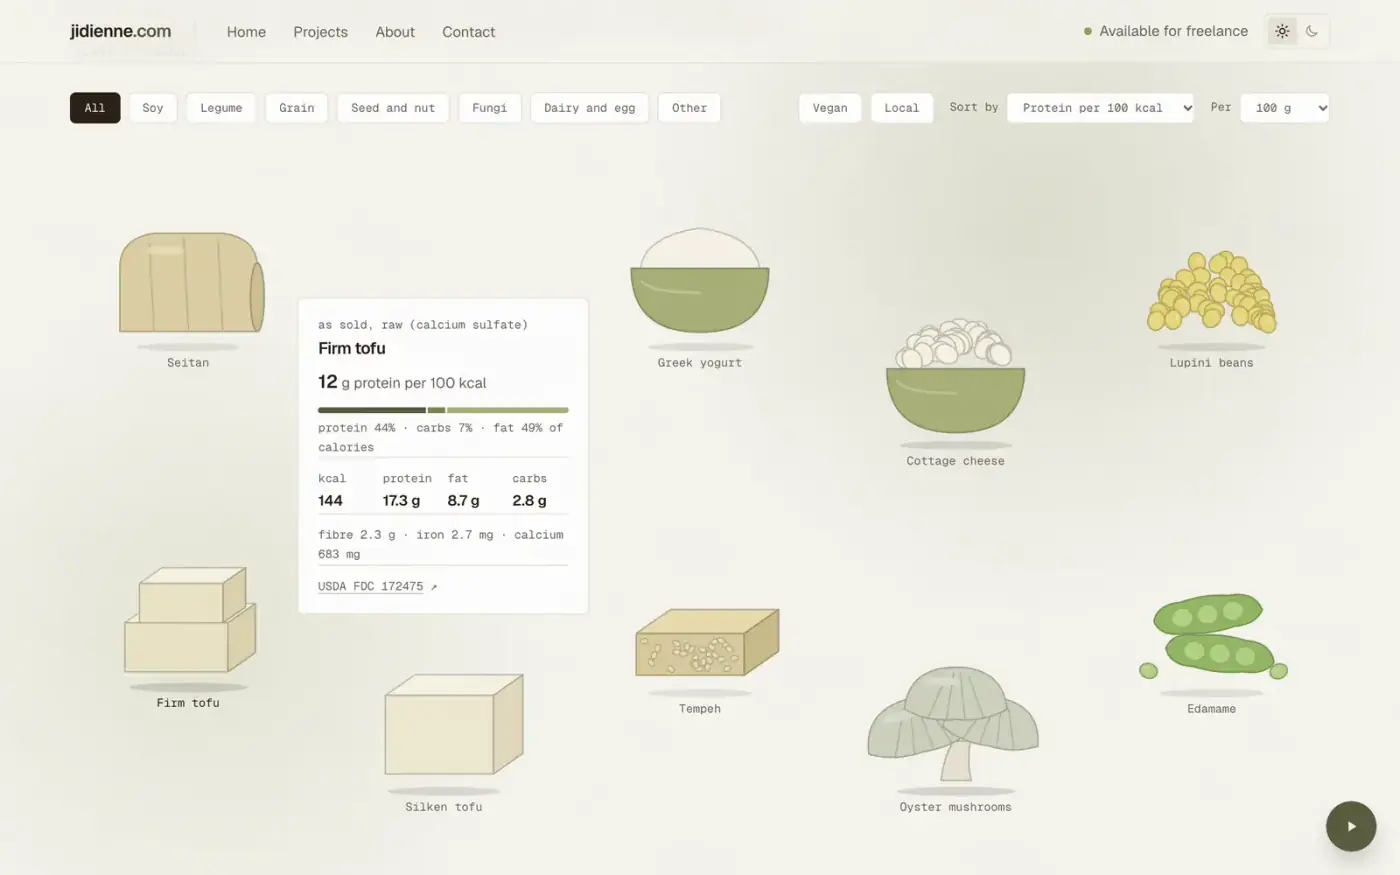
Data, and why none of it is typed by hand
The numbers come from USDA FoodData Central through a small script, and nothing is edited afterwards. Each food states its basis (raw, cooked, dry) on its panel, because that is where comparisons quietly break. Seitan tops the list at 20.3 g per 100 kcal partly because it is dry vital wheat gluten, while lentils are listed cooked at 7.8. The panel says so. Making those comparable is the next problem, not a solved one.
Four foods on my list (yuba, paneer, nutritional yeast and textured soy protein) had no clean USDA entry, so they are not on the page. I would rather ship 28 sourced foods than 32 with four guesses. It is reference data, not dietary advice, and the page says that too.
Interaction
The float is CSS only. Each item gets its own duration and offset so nothing moves in sync, with a soft shadow that scales underneath. Filters (category, vegan, local), four sorts and a per 100 g or per serving switch reflow the grid by measuring where each item was and animating the difference. The view lives in the URL, so a link to vegan soy per serving is a real link.
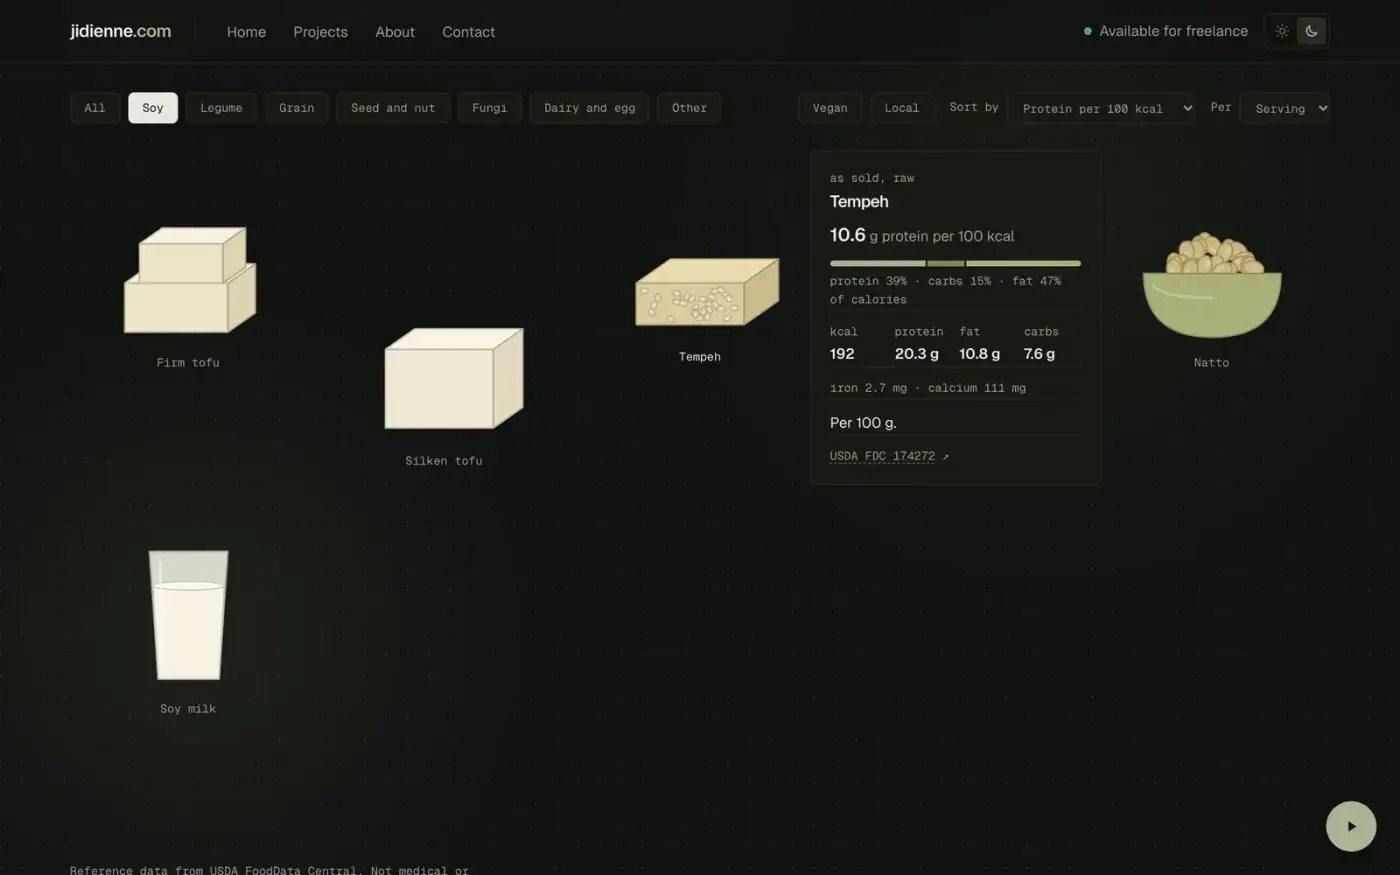
On a phone the panel docks to the bottom as a sheet, and tapping elsewhere or pressing Esc closes it. Keyboard focus opens the same panel. Reduced motion is handled on purpose: instead of freezing, the float drops to a two pixel wander on a slow loop.
How it was made
The cutouts are flat illustrations drawn by a script in one style, 216 KB for all 28, which is lighter than most hero photos. The whole thing was built with Claude Code in this repo, working from a written plan, one phase at a time.
What I would do next
- Local foods: yuba, more tofu varieties and kacang pool, from the Malaysian Food Composition Database once I have read its terms.
- A switch to compare everything on the same basis, all cooked or all dry.
- A chart view with calories against protein, still floating.
- Photos instead of drawings, maybe.